
The cheapest way to bridge crypto is almost never the bridge itself. It's the exchange withdrawal rail you pick before you ever touch a bridge, plus the trade size and gas conditions at that moment. If your exchange offers a free or near-free native withdrawal on a cheap rail like Plasma, TRC20, or Solana, use it and skip a canonical bridge entirely. If you must bridge, the winning route depends on a real formula: True Cost = withdrawal fee + bridge fee + destination gas + slippage + time cost.
Three thresholds matter most:
- For small trades, fixed costs dominate, so the choice of withdrawal rail matters more than bridge selection.
- For medium trades, gas fees influence whether it is better to use a cheap-rail bridge or direct ERC20.
- For larger trades, percentage fees and slippage become more significant, making canonical bridges more competitive.
Open OmniRout or a fee comparator now, punch in your actual amount, and read the all-in percentage before moving a single dollar.
Key Takeaways
The cheapest way to bridge crypto depends on trade size and live gas conditions, and calculating True Cost before you move funds beats trusting any advertised fee number.
| Point | Details |
|---|---|
| Use True Cost, not headline fees | Add withdrawal fee, bridge fee, destination gas, slippage, and time cost before comparing routes. |
| Small trades favor cheap rails | Under $300, use Plasma, TRC20, or Solana withdrawals before bridging to avoid fixed-cost drag. |
| Watch mainnet gas | Above roughly 30 gwei, CEX withdrawal plus a cheap-rail bridge typically beats direct ERC20. |
| Large trades favor canonical bridges | Over $500 to $5,000, percentage fees and slippage matter more than fixed costs. |
| Compare live, not static, quotes | Run a route comparison in Omnirout to see all-in cost across 30+ chains before executing. |
Table of Contents
- What Is the Cheapest Way to Bridge Crypto, Really?
- What's the Cheapest Route for My Trade Size?
- How Much Does It Actually Cost to Bridge $300 vs $1,000?
- Your Pre-Bridge Checklist and the Mistakes That Cost You
- How OmniRout Finds Your Cheapest All-In Route
- Where to Check Live Bridge Costs
- What the Data Actually Tells You to Do Differently
- Compare Your Route Before You Send a Single Dollar
- Sources
What Is the Cheapest Way to Bridge Crypto, Really?
"Cheapest" only means something once you attach a number to it, and that number is True Cost, not the fee line an app shows you at checkout. Most wallets and bridge widgets display only the bridge's own protocol fee, which is why two apps quoting "0.1%" can leave you with wildly different amounts on the other side. Yieldo's True Cheapest Route analysis breaks the real cost into five pieces:
- Source withdrawal fee — what your exchange or wallet charges to move funds off-platform.
- Bridge fee — the protocol's own cut, often a flat amount or a small percentage.
- Destination gas — the cost to receive and often approve the asset on the new chain.
- Slippage — the spread you eat if the bridge routes through a liquidity pool instead of a 1:1 mint.
- Time cost — a soft cost, but real if you're paying funding rates or missing a window while funds sit in transit.
Aggregators frequently stop at fee number two and call it a day. That's how a "cheap" bridge ends up costing more than a boring native withdrawal once destination gas and slippage get added in.
Trade size changes which of these five pieces actually moves the needle. On a $300 transfer, a $4 destination gas fee is over 1% of the trade by itself, so fixed costs swamp everything else. OpenChainBench's benchmark data specifically samples at $300 notional because it exposes this dynamic. On a $5,000 transfer, that same $4 gas fee is noise. What matters instead is slippage on a thin liquidity pool, which can run 0.3% to 1% or more depending on congestion.
Statistic to remember: at $300 USDC, the cheapest corridor leaders on OpenChainBench have posted an all-in bridge_cost_percent as low as 0.020% (p50, 24h), while a naive ERC20 path on a congested day can run 20 to 50 times higher.
Mainnet gas is the single biggest lever you don't control. As a rough rule from Yieldo's analysis, when base fee sits under roughly 15 gwei, a direct ERC20 route can be competitive for small moves. Above roughly 30 gwei, CEX withdrawal plus a cheap-rail bridge usually wins, sometimes by a wide margin.
What's the Cheapest Route for My Trade Size?
Route selection isn't one-size-fits-all. It shifts with how much you're moving and where it's headed.
Small transfers (under $300). Rail beats bridge here, full stop. If your exchange lists Plasma, TRC20, Solana, or an XLM/XRP rail for the asset you're holding, withdraw natively on that rail first. Only bridge afterward if the destination chain genuinely requires it. Skipping this step on a small trade is the single most common way people overpay.

Medium transfers ($300–$500). Check a gas tracker before doing anything. If mainnet is calm, a direct bridge might beat the extra hop through an exchange. If gas is elevated, fall back to the cheap-rail-then-bridge pattern from the small-trade tier.
Large transfers (over $500, especially over $5,000). Percentage fees and slippage now outweigh fixed costs. Canonical bridges from the destination chain's own team often reclaim the lead, since they typically offer 1:1 minting with minimal slippage versus liquidity-pool-based aggregators. For amounts that would meaningfully move a pool's price, splitting the transfer into two or three smaller chunks across different routes can lower total slippage.
Exchange-to-exchange transfers. Don't move your native asset directly if it's expensive to bridge. Convert to a cheap stablecoin rail (Plasma or TRC20 for USDT is the classic example), move it, then convert back on the receiving exchange. This pattern shows up constantly in live transfer-fee comparisons because most major exchanges now offer at least one near-zero-fee stablecoin withdrawal option.
One more wrinkle: pricing architecture itself varies by bridge type. OpenChainBench identifies three distinct models: direct protocol fees, liquidity-pool-based aggregator fees, and intent/relay markups. Each behaves differently as trade size grows, which is exactly why a single "cheapest bridge" claim rarely holds up across every corridor.
How Much Does It Actually Cost to Bridge $300 vs $1,000?
Numbers settle arguments faster than theory. Here are two corridors worked out in full.
- $300 USDC, naive path. Withdraw USDC as ERC20 from an exchange (fixed fee, call it $3), bridge to an L2 through a standard liquidity-pool bridge (0.1% fee plus roughly 0.3% slippage on a thin pool), pay destination gas (roughly $1 to $2 on an L2). Total cost lands around $5.50 to $6.50, or roughly 2% of the trade.
- $300 USDC, optimized path. Withdraw as TRC20 or on a Plasma rail (often $0 fee), bridge or swap into the target chain's stablecoin (well under 0.1% total), destination gas on an L2 (around $0.30 to $1). Total cost often lands closer to $1 to $2, in the same range Yieldo documented when it found optimized paths cutting cost 40 to 80% versus naive ERC20 routes.
If mainnet gas spikes above roughly 40 to 50 gwei on the day you transfer, both paths get more expensive, but the naive ERC20 path suffers more because a bigger share of its cost is gas-driven rather than fee-driven.
Your Pre-Bridge Checklist and the Mistakes That Cost You
Run through this before you send anything:
- Confirm the receiving network matches exactly. Wrong network selection is the single most common cause of funds arriving nowhere.
- Check whether your exchange offers a native withdrawal on a cheap rail before opening a bridge app at all.
- Glance at a gas tracker. Elevated mainnet gas changes the entire calculation.
- Run a live quote through an aggregator and compare the all-in percentage, not the headline fee.
- Send a small test amount first on any corridor or bridge you haven't used before.
Pro Tip: Convert to a stablecoin on a cheap rail before bridging whenever your target asset isn't itself the stablecoin. Re-converting on the other side almost always costs less than bridging a volatile asset directly through a low-liquidity pool.
Watch for red flags too: unlabeled or ambiguous network names in a withdrawal menu, relayer addresses you can't verify on a block explorer, and rails that show as "temporarily disabled" but still let you submit a withdrawal request. Smart contract risk is real. Bridges have been the target of some of crypto's largest hacks, so favor bridges with a long track record and avoid anything asking for unusual approvals.
How OmniRout Finds Your Cheapest All-In Route
Omnirout was built around exactly the True Cost problem this article describes. It's a non-custodial DEX and bridge aggregator covering more than 30 blockchains, and its route comparison feature exists specifically because headline fee numbers hide the real cost of a transfer.
The gap between an advertised bridge fee and the actual amount that lands in your wallet is where most people lose money without noticing. Comparing routes on fees, gas, and slippage together, before you commit, is the only way to close that gap.
Here's what it does when you run a quote:
- Pulls live routes across dozens of chains and calculates estimated fees, destination gas, and slippage together.
- Surfaces an effective all-in cost for each route so you can compare apples to apples, similar in spirit to the bridge_cost_percent metric OpenChainBench tracks.
- Keeps you non-custodial throughout, meaning your keys never leave your control while routes are compared and executed.
- Works whether you're moving $50 or $50,000, since the comparison logic adjusts for trade size automatically.
Prefer manual checks when you're testing an unfamiliar corridor for the first time with a small amount. Prefer a live aggregator quote for anything you're moving in real size, since gas and liquidity conditions shift by the hour and a static blog table can't keep up.
Where to Check Live Bridge Costs
For current leaderboard numbers, check OpenChainBench's live benchmarks, which refresh frequently and show per-corridor leaders by all-in cost. For the full worked-math behind the True Cost framework, read Yieldo's True Cheapest Route analysis. For a quick side-by-side on a specific corridor, CryptoCalk's bridge comparator works well.
What the Data Actually Tells You to Do Differently
Most advice on this topic treats bridging like picking a restaurant: read reviews, pick the popular one, move on. That's backwards. The bridge itself is rarely where you lose money. The decision you make one step earlier, which rail to withdraw on, decides most of the outcome, and that step gets skipped constantly because it feels like a side detail rather than the main event.
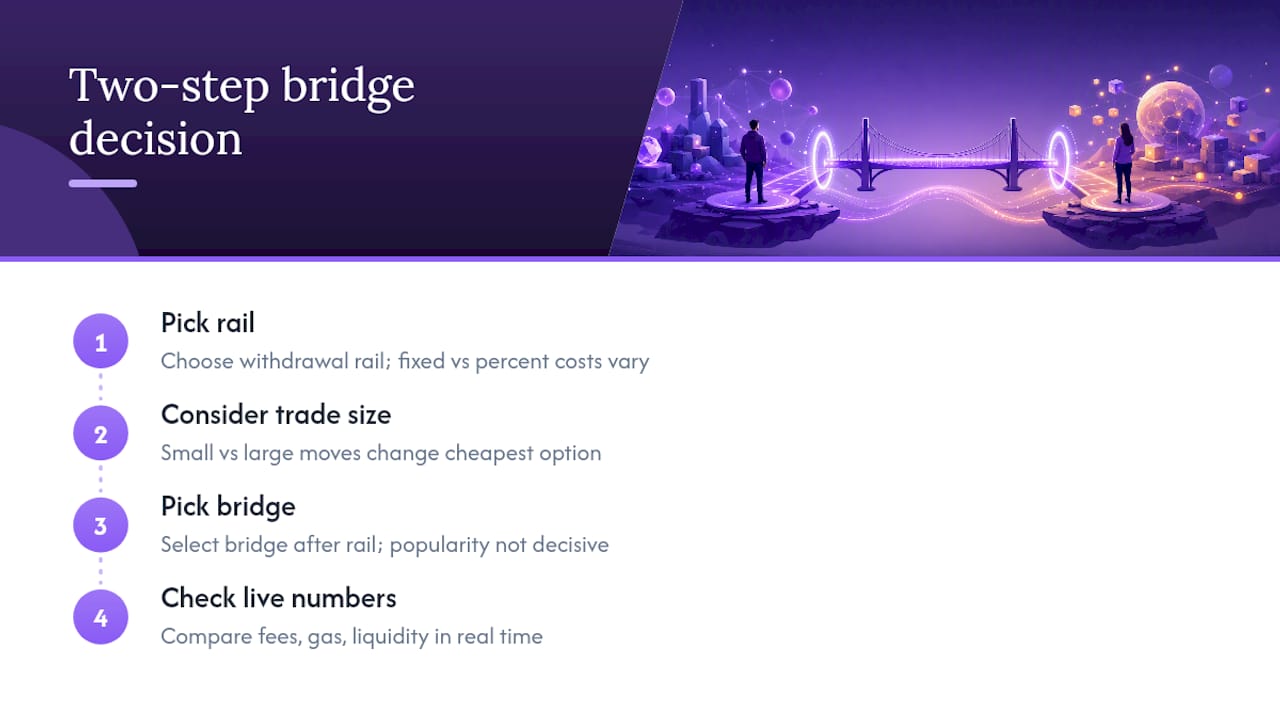
The conventional wisdom to "just use the most popular bridge" also falls apart once you look at how pricing architecture varies by corridor. A bridge that's cheapest for a $10,000 move can be one of the worst options for $300, because fixed costs and percentage costs behave completely differently as trade size changes. Anyone giving you a single "best bridge" recommendation without asking your trade size is guessing.
What actually works is treating every transfer as a two-part decision: pick the rail first, then pick the bridge, and check both against live numbers instead of a blog post written six months ago. Gas conditions and liquidity depth change by the hour. A framework holds up. A fixed ranking doesn't.
— Emanuele
Compare Your Route Before You Send a Single Dollar
Omnirout gives you the one thing a fixed comparison table never can: a live, all-in cost check for your exact trade size and corridor, run the moment you're ready to move funds. Instead of guessing which rail or bridge is cheapest today, you see fees, destination gas, and slippage side by side across more than 30 chains, and you keep full control of your keys the entire time.
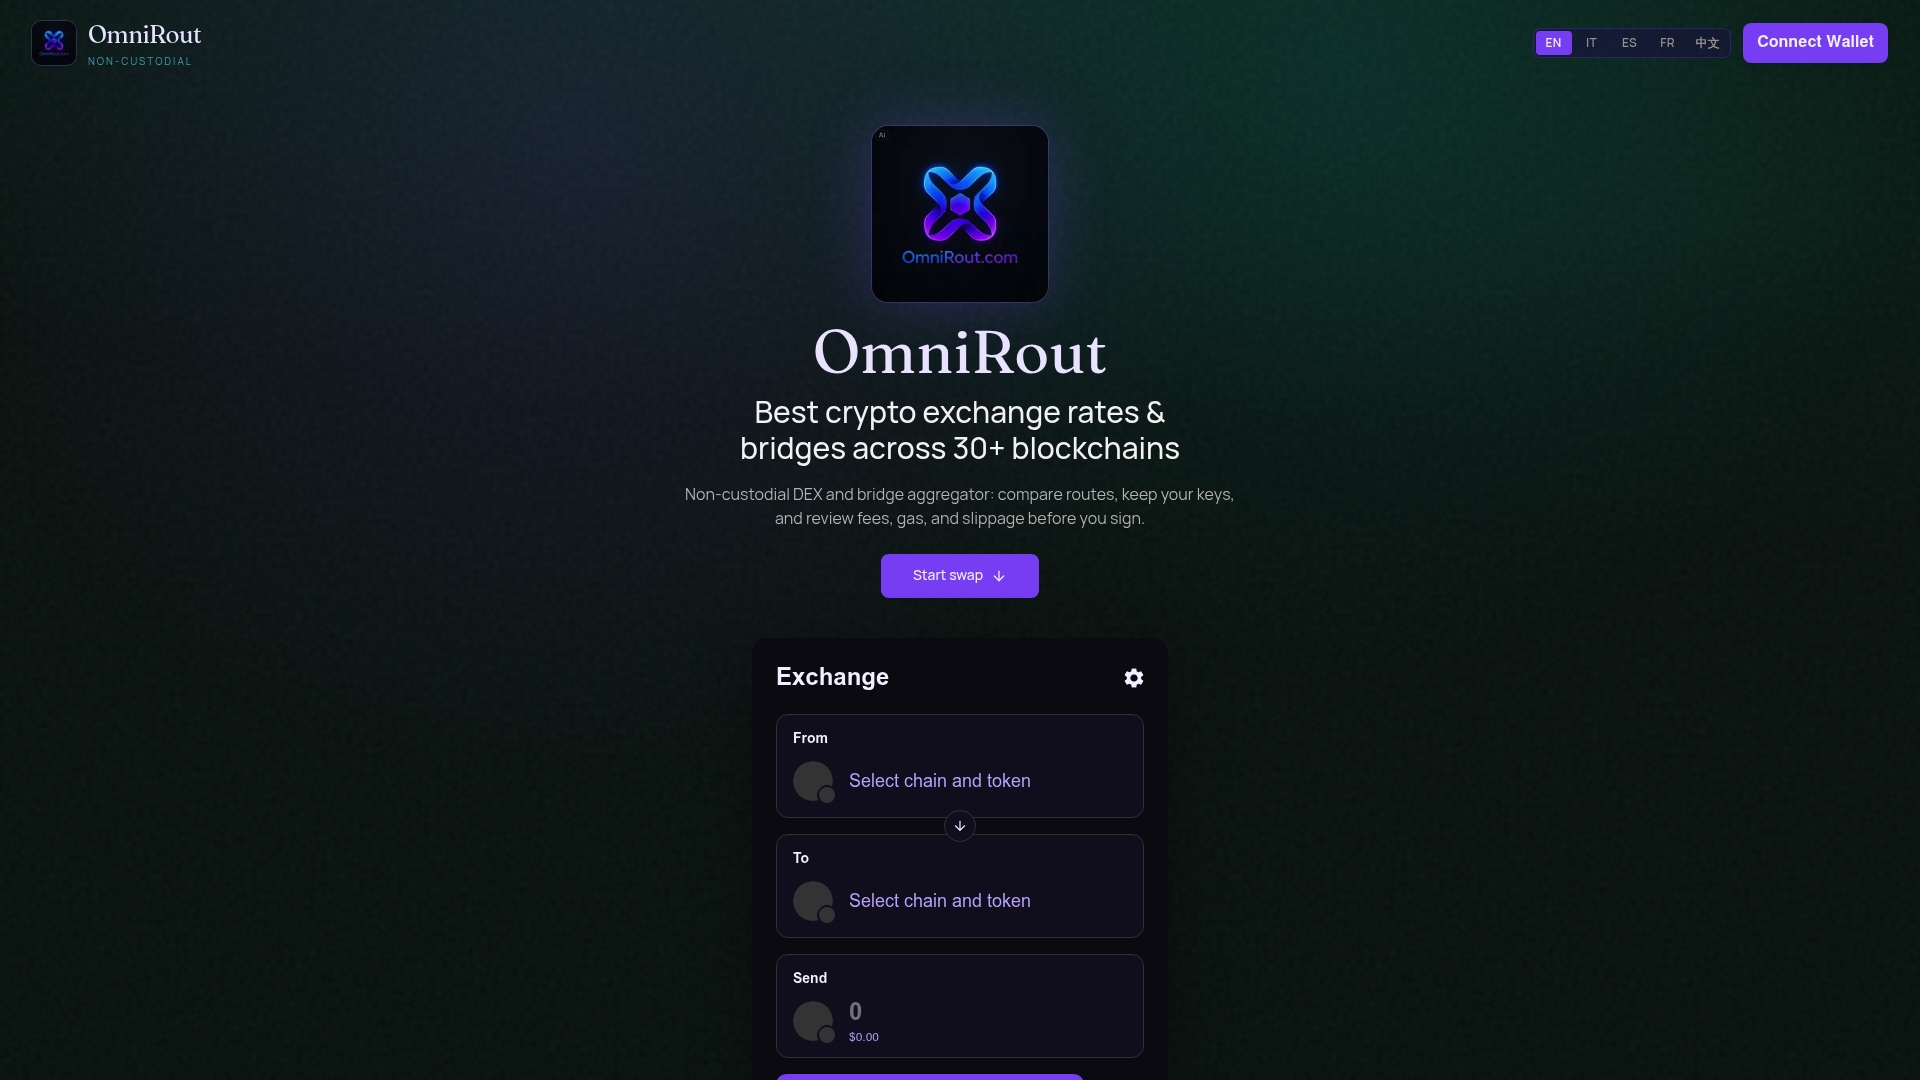
That matters most for the readers this article is written for: people moving real money across chains regularly, not once a year. If you've been eyeballing bridge fees off a screenshot from a Discord server, you're operating on stale information. Run your $300, your $1,000, or your $5,000 transfer through OmniRout's route comparison tool before you send it, and let the live quote tell you which path actually keeps the most money in your wallet.
Sources
- OpenChainBench — Cheapest cross-chain bridge (benchmarks)
- True Cheapest Route: CEX withdrawal + Bridge vs ERC20 (Yieldo)
- Bridge Cost Comparator — CryptoCalk