
A crypto swap's real price tag is network gas plus the provider or liquidity fee plus the spread and price impact baked into the rate, plus a bridge fee if the trade crosses chains. None of that matters as much as one habit: compare the final "you receive" amount across quotes, not the advertised rate. On small swaps, the hidden spread often costs more than every visible fee combined.
TL;DR:
- Comparing the final "you receive" amount is essential, as the hidden spread on small swaps can cost more than visible fees combined.
- Network gas fees can vary significantly depending on congestion, with layer 2 networks and batching helping to reduce costs.
- Swap rates often differ vastly from market rates due to spread, price impact, and volatility premiums, especially on fixed-rate quotes.
- Using an aggregator to compare multiple routes and selecting the best chain for your trade can save substantial fees, especially for cross-chain swaps.
- Transparent breakdowns of gas, provider fees, and slippage are crucial for accurately assessing the true cost of a crypto swap before execution.
Table of Contents
- What makes up crypto swap fees?
- Why does the quoted rate differ from the market rate?
- How do you compare swap quotes fairly?
- How can you actually lower what you pay?
- What does a real fee breakdown look like in practice?
- Why transparent fee breakdowns matter more than most traders realize
- Get the full fee picture before you swap
- Sources
What makes up crypto swap fees?
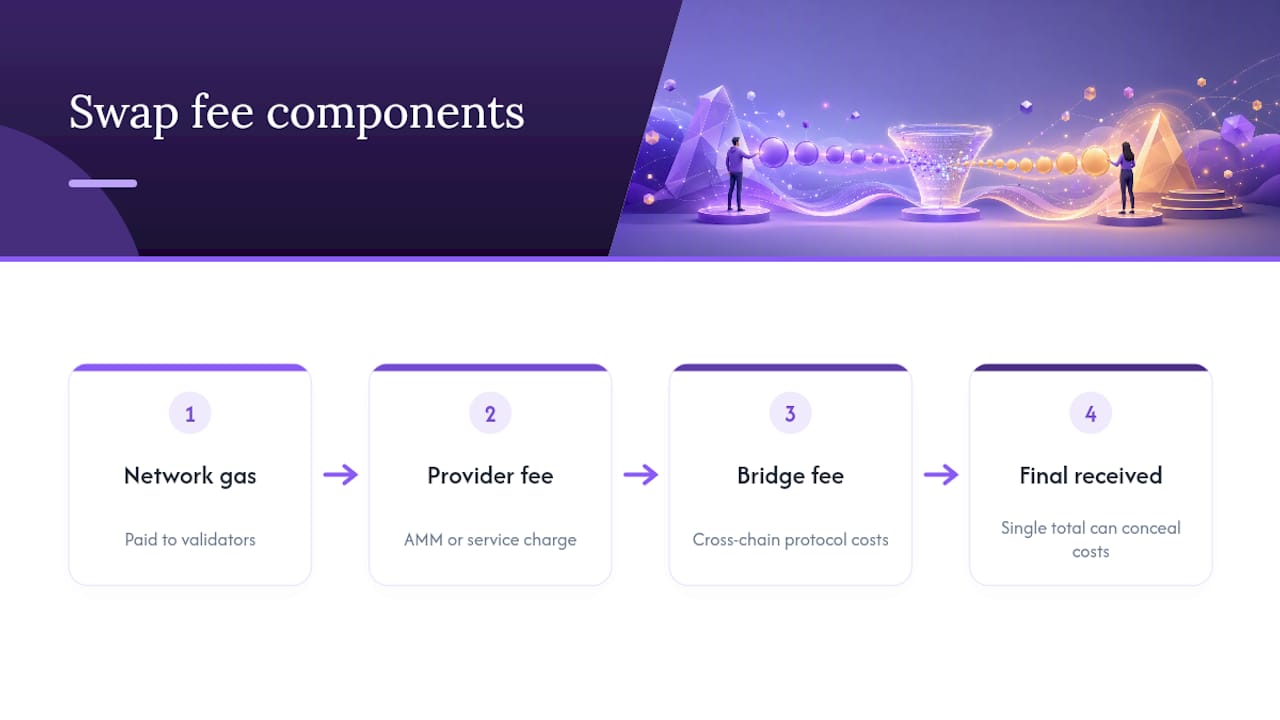
Every swap you execute is really three or four charges stacked on top of each other, and most interfaces only show you one or two of them clearly.
Network gas fee. This is paid in the blockchain's native token (ETH on Ethereum, SOL on Solana) directly to the validators who process your transaction. It has nothing to do with the exchange or aggregator you're using, and it swings with network congestion. A swap that costs $2 in gas on a quiet Sunday can cost $40 during a busy mint or a market crash. Layer 2 networks and transaction batching cut this cost significantly by grouping many trades into one settlement.
Provider or liquidity fee. This is the explicit service charge the swap provider or the automated market maker (AMM) pool takes for facilitating the trade. Sometimes it's a clean line item ("0.3% provider fee"). Sometimes it's folded silently into the exchange rate you're quoted, which is where things get murky.
Bridge or cross-chain fee. Moving an asset from one blockchain to another adds a protocol-level cost layered on top of gas: relayer fees, solver margins, and confirmation costs on both chains.
In a well-built trade preview, you should be able to spot each of these as separate lines. Coinbase's fee disclosures note that network fees are estimates that can shift due to batching and congestion, while spread and any DEX service fee get quoted separately. If a preview shows you only one number with no breakdown, assume something is embedded that you can't see.
Why does the quoted rate differ from the market rate?
The gap between the price you see on a chart and the price you actually get comes down to two things: spread and price impact. Spread is the built-in markup between what a pool or market maker pays for an asset and what it sells it for. Price impact is what happens when your trade is big enough, relative to available liquidity, to move the price against you as it executes. Thin pools and large trade sizes make both worse.
Fixed-rate quotes add a third layer: a volatility premium. When a provider locks your rate for a set window (say, 15 minutes), it has to protect itself against the asset moving against it before settlement, so it prices in a cushion. Floating-rate quotes skip that cushion but expose you to whatever the market does between quote and execution.
The gap can be enormous. A modeled $500 swap tested across six instant-swap platforms found total costs ranging from about $0.40 to more than $35, a difference driven almost entirely by embedded spread rather than any disclosed fee.
That's the trap with "instant convert" widgets and one-click swap buttons: they look cheap because the fee line reads $0 or near it, while the spread quietly runs 1 to 2 percent or higher. Small trades get hit hardest, because fixed per-swap costs don't scale down the way percentage fees do. A $50 swap can lose a bigger share of its value to spread than a $5,000 one.
How do you compare swap quotes fairly?
Stop comparing exchange rates. Start comparing what actually lands in your wallet.
- Look at the "you receive" figure, not the headline rate. This is the one number that already nets out spread, provider fees, and price impact.
- Check whether network gas is included. Some quotes bake it in; others quote it separately and add it at execution. If it's separate, add your own estimate before comparing across providers.
- Confirm fixed vs. floating. A fixed quote guarantees the number but carries a volatility premium; a floating quote can move against you, so check your slippage tolerance setting before confirming.
- Verify settlement type. Are you receiving actual tokens on-chain, or an internal balance on a custodial platform that charges a separate fee to withdraw later? Custody mode changes how and where network fees get applied, so read the fine print before you assume you're comparing like for like.
Pro Tip: Screenshot the "you receive" amount on two or three routes before you commit. Rates move fast enough that a five-minute comparison window can already be stale, so compare quotes taken close together in time.
How can you actually lower what you pay?
A few deliberate choices cut real money off your swap costs, and they compound.
- Pick the chain to match the trade. Small trades on congested Layer 1 networks can lose more to gas than to any other fee; a Layer 2 or a cheaper native chain often beats bridging overhead for the same pair.
- Run the same trade through an aggregator before executing anywhere. Comparing gas, provider fees, and slippage across multiple liquidity sources at once is the fastest way to catch a route that's quietly worse than its neighbors.
- Use floating rates for small trades, fixed rates only for large ones. The volatility premium on a locked quote is rarely worth paying unless the trade size makes even a small adverse move meaningful.
- Favor order-book venues and limit orders when the asset and size allow it. Instant-convert spreads commonly run 1 to 2 percent above standard maker or taker fees, and a limit order sidesteps that markup entirely.
- Watch fiat rails separately. Card-funded purchases and bank withdrawals carry their own fee structure on top of whatever the swap itself costs.
Exchange-level fee tiers matter too. Fee schedules on venues like Kraken scale with 30-day trading volume and differ between maker and taker orders, and broader surveys of exchange pricing show that native-token discounts and volume tiers can meaningfully change your effective rate over time, even if they don't move the needle on a single swap. For chain selection specifically, comparing gas costs across networks before you commit to a route saves more than most people expect.
Pro Tip: Set your slippage tolerance intentionally rather than accepting the default. Too tight and your trade fails during normal volatility; too loose and you're inviting a worse fill than necessary. Understanding realistic slippage ranges for your asset pair beats guessing.
What does a real fee breakdown look like in practice?
A route comparison screen earns its keep by putting gas, provider fee, and slippage on the same line, side by side, for every path a trade could take.
- Gas estimate for the destination chain, quoted in that chain's native token.
- Provider or liquidity fee, shown as its own percentage rather than folded into the rate.
- Estimated slippage, based on current pool depth for your trade size.
- Final "you receive" amount, the number that actually matters.
Switching the routing chain on an identical trade can lower the modeled total cost meaningfully, purely by avoiding a congested network or a thin liquidity pool on the default path. That's the value of seeing every component before you sign anything, rather than discovering the real cost after settlement. For traders moving assets across networks regularly, understanding how multi-hop routing affects total cost adds another layer of control worth learning.
Why transparent fee breakdowns matter more than most traders realize
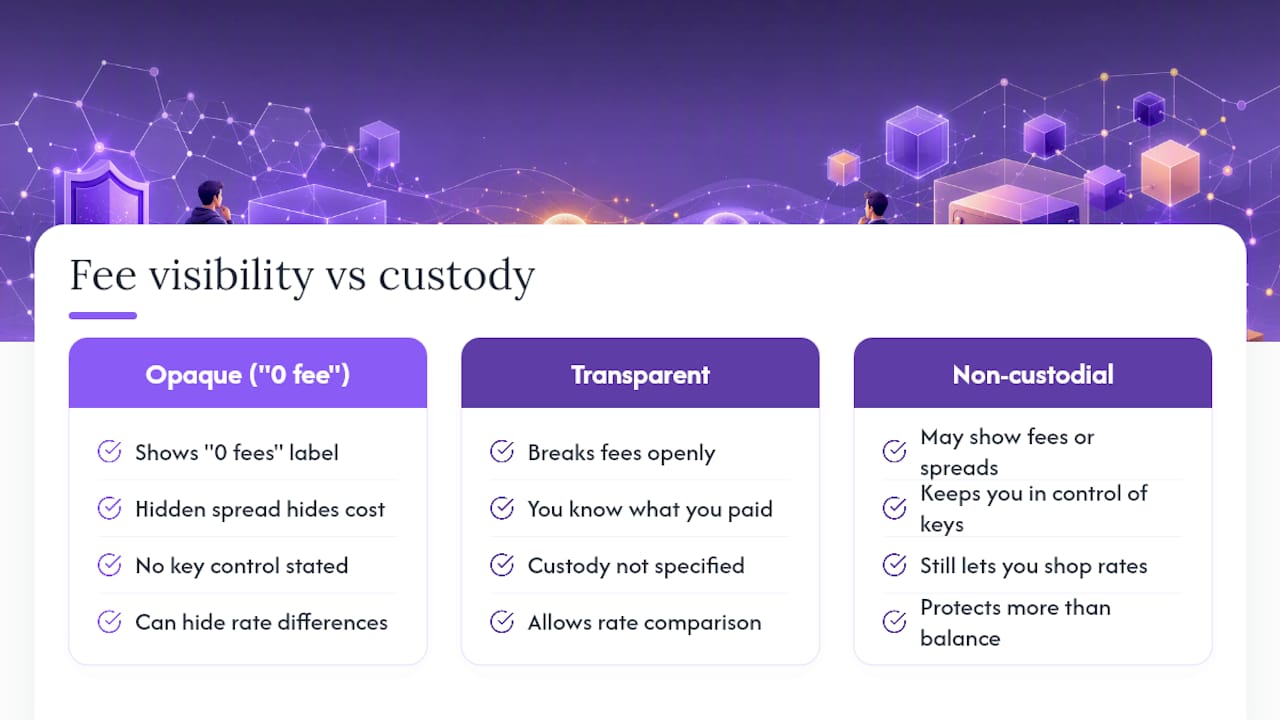
They're the ones showing "0 fees" with a spread quietly doing the damage instead. Transparency isn't a nice feature, it's the only way to know what you actually paid.
Non-custodial route comparison protects more than your wallet balance. It keeps you in control of your keys while still letting you shop rates, which matters more the more often you trade. For deeper reading on how custody and fee visibility interact, the non-custodial exchange breakdown is worth your time.
— Emanuele
Get the full fee picture before you swap
Omnirout is built for exactly the problem this article just walked through: fee structures that hide more than they show. Instead of trusting one provider's quote, Omnirout compares routes across more than 30 blockchains side by side, surfacing gas, provider fees, and slippage in the same preview so you can see the real "you receive" number before you commit to anything.
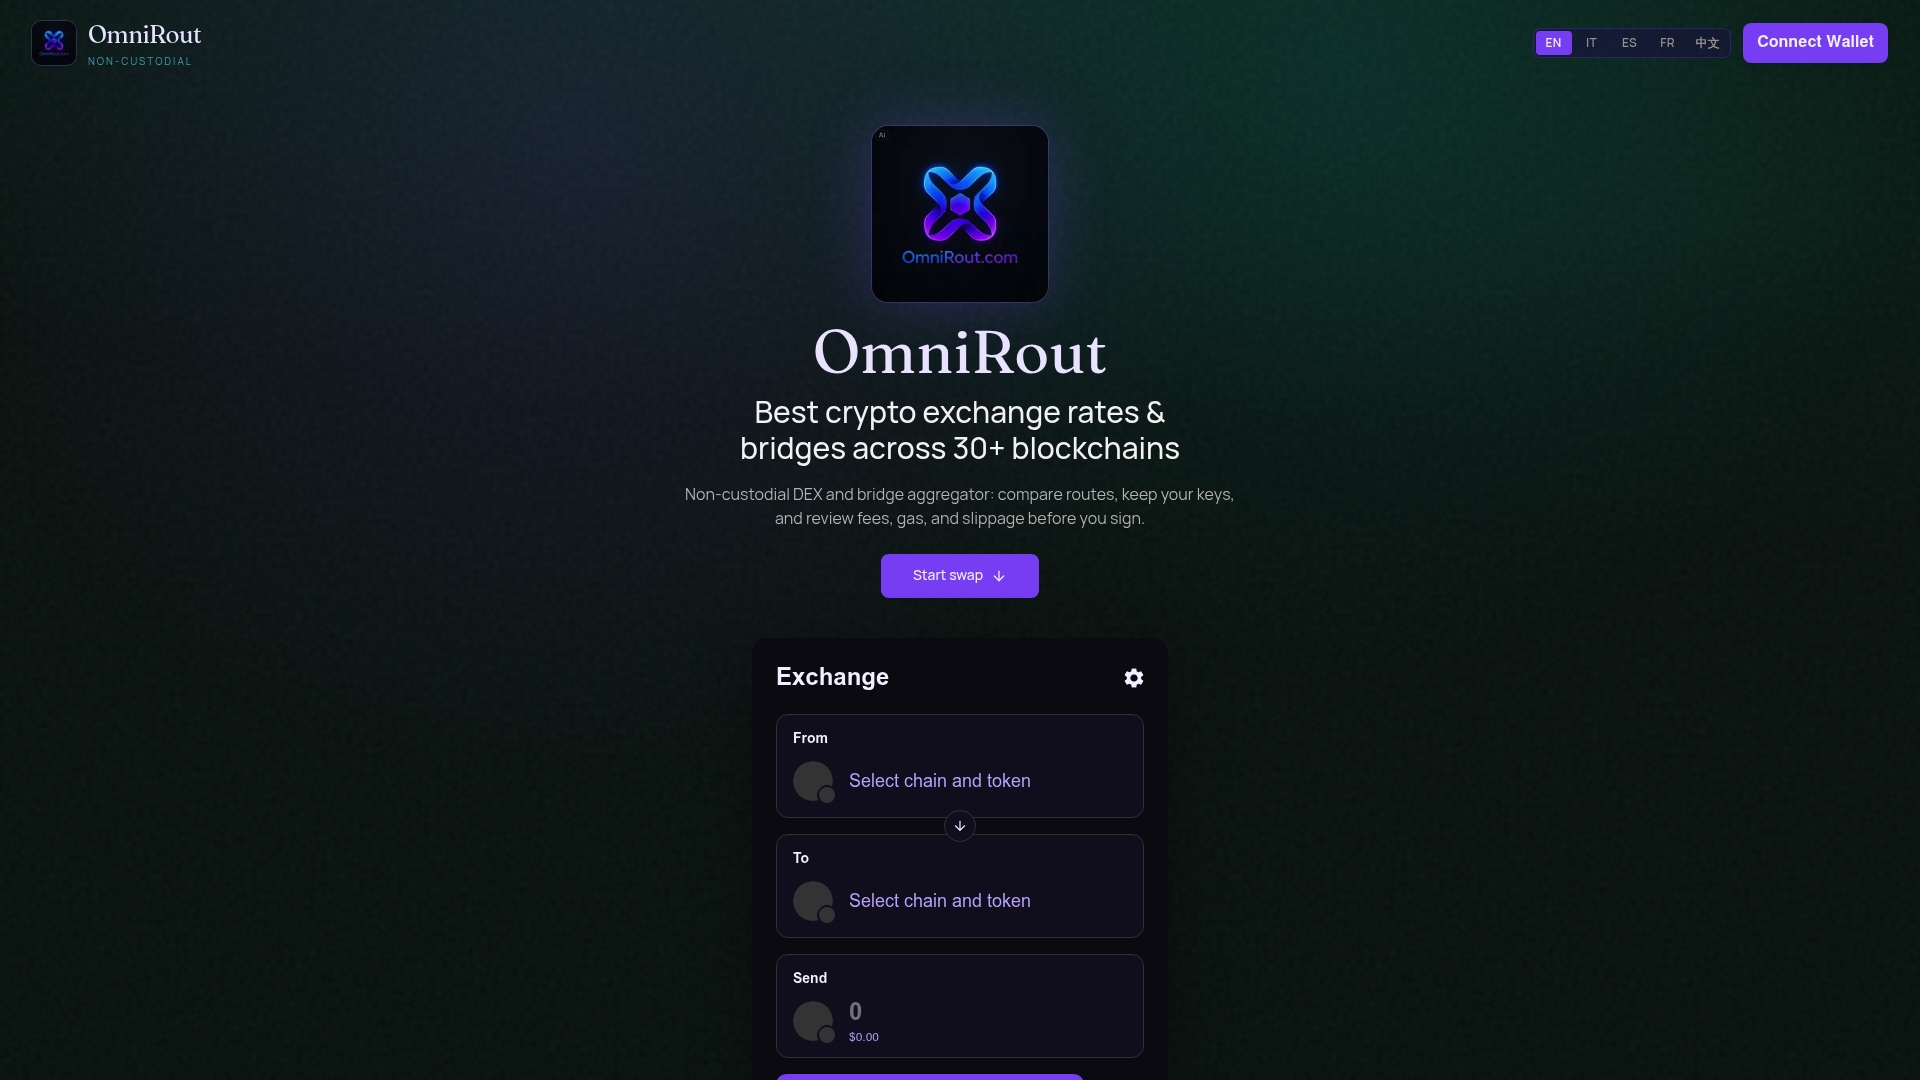
Because Omnirout is non-custodial, you never hand over your keys to get that comparison. Your funds stay in your own wallet the entire time, and you approve the exact route you picked, not whatever a hidden algorithm decided was good enough. If you're tired of guessing whether a "no fee" swap is actually cheap, compare your next route on Omnirout before you send the transaction.
Sources
- Coinbase pricing and fees disclosures - crypto | Coinbase Help
- Crypto Swap Spread Tracker: Which Instant Swap Platform Is Cheapest? - Decentralised News
- Crypto Exchange Fees Compared (2026): Maker, Taker, Token Discounts, and How to Get Trading Fees Back